 search console
Does your code improve your search ranking? Know at merge.
Most engineering teams ship and hope. Code Results predicts which deploys will move your rankings the moment they merge — then confirms it once your search data lands.
The full picture,
from merge to rank.
Four data layers. One dashboard. Finally connected.
Developer Velocity
PR throughput, cycle time, and churn — by repo, by sprint, by person. Not a headcount report.
Search Performance
Your Search Console data syncs automatically. Impressions, clicks, CTR, rankings — always fresh.
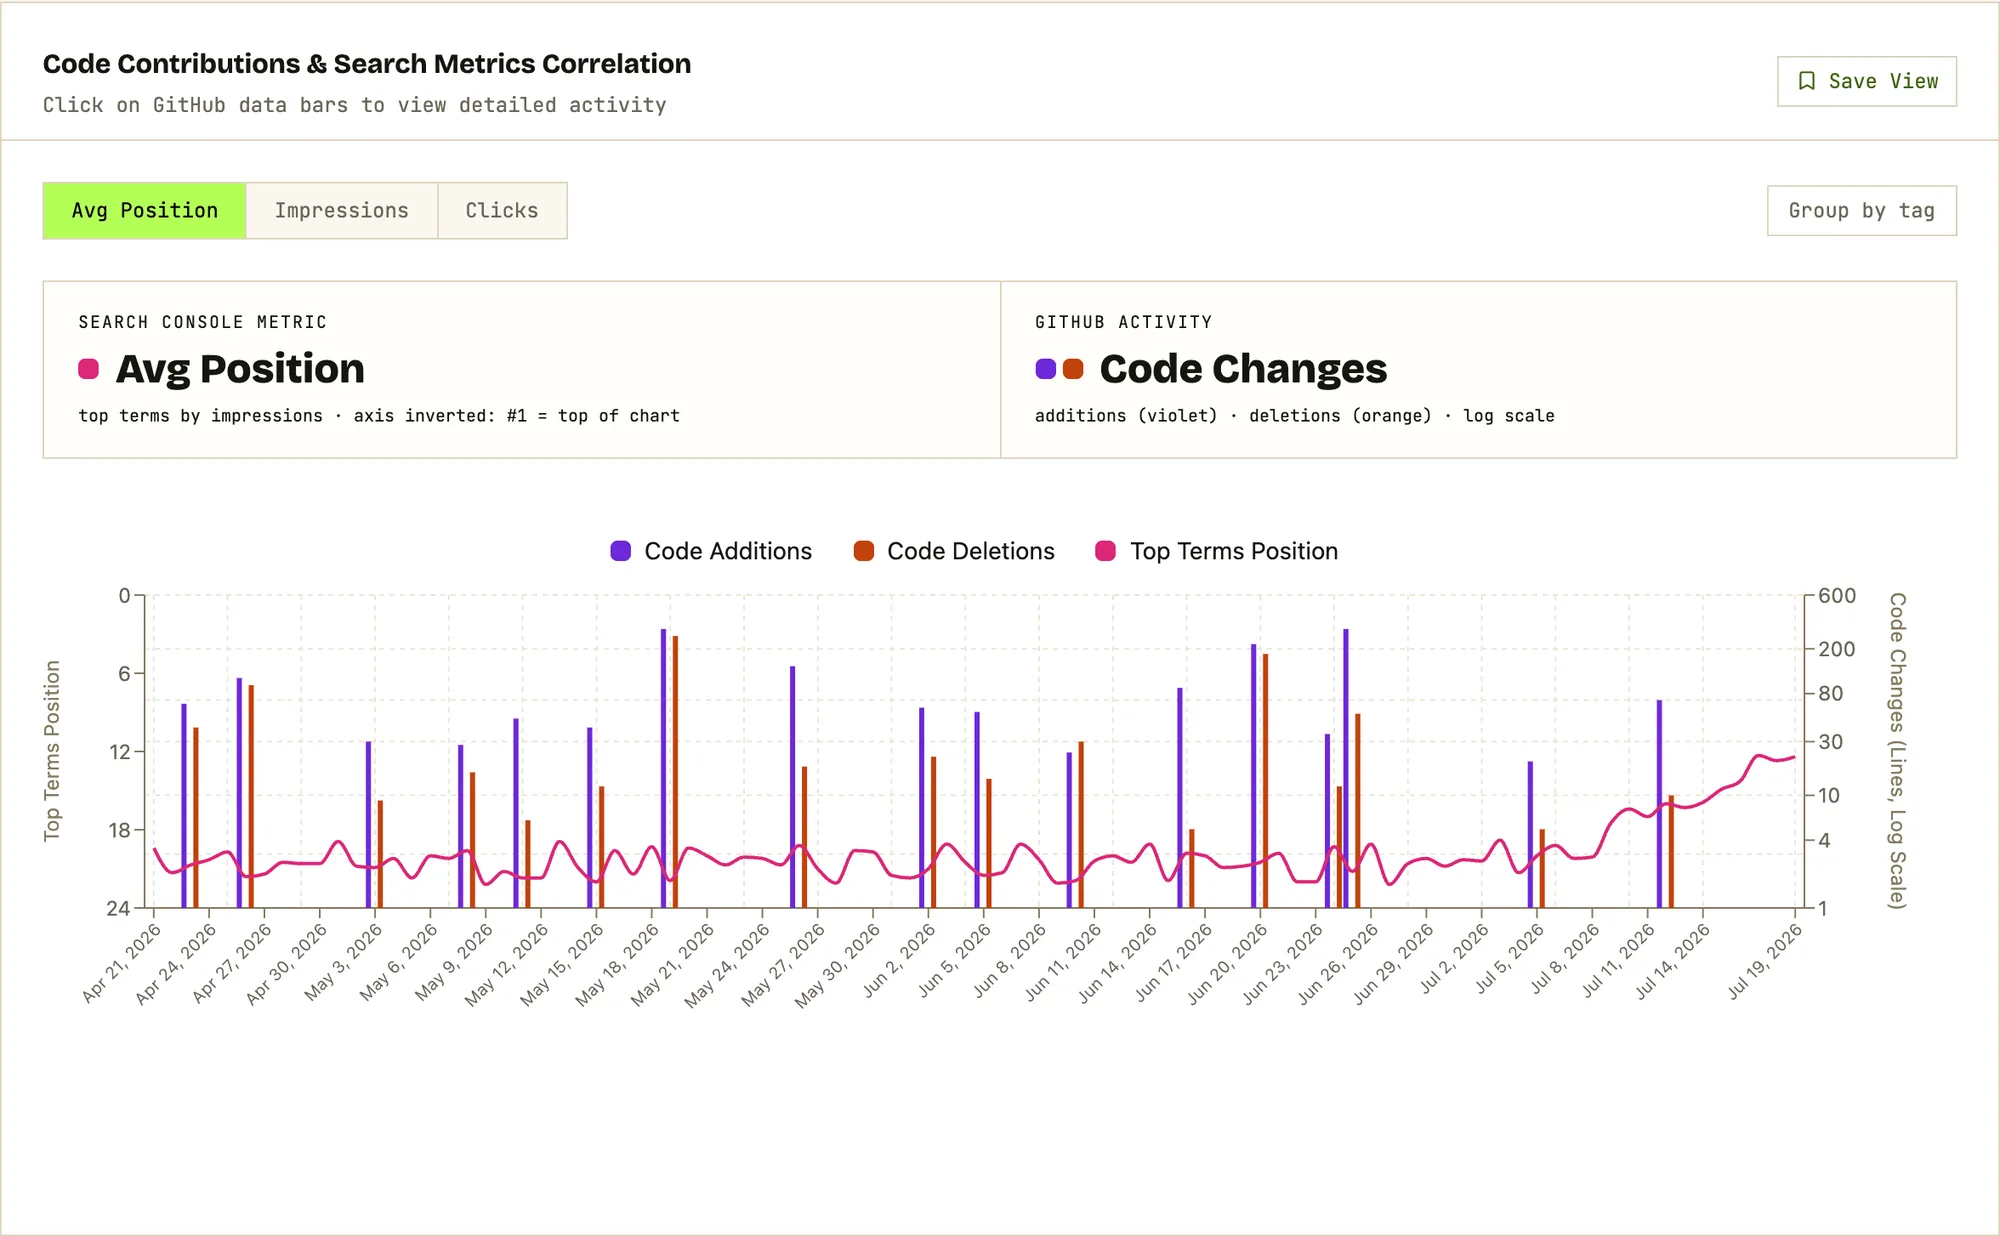
Code-to-SEO Correlation
We overlay your deploy history with your search trends. See — not guess — the lag between shipping and ranking.
AI Causal Attribution
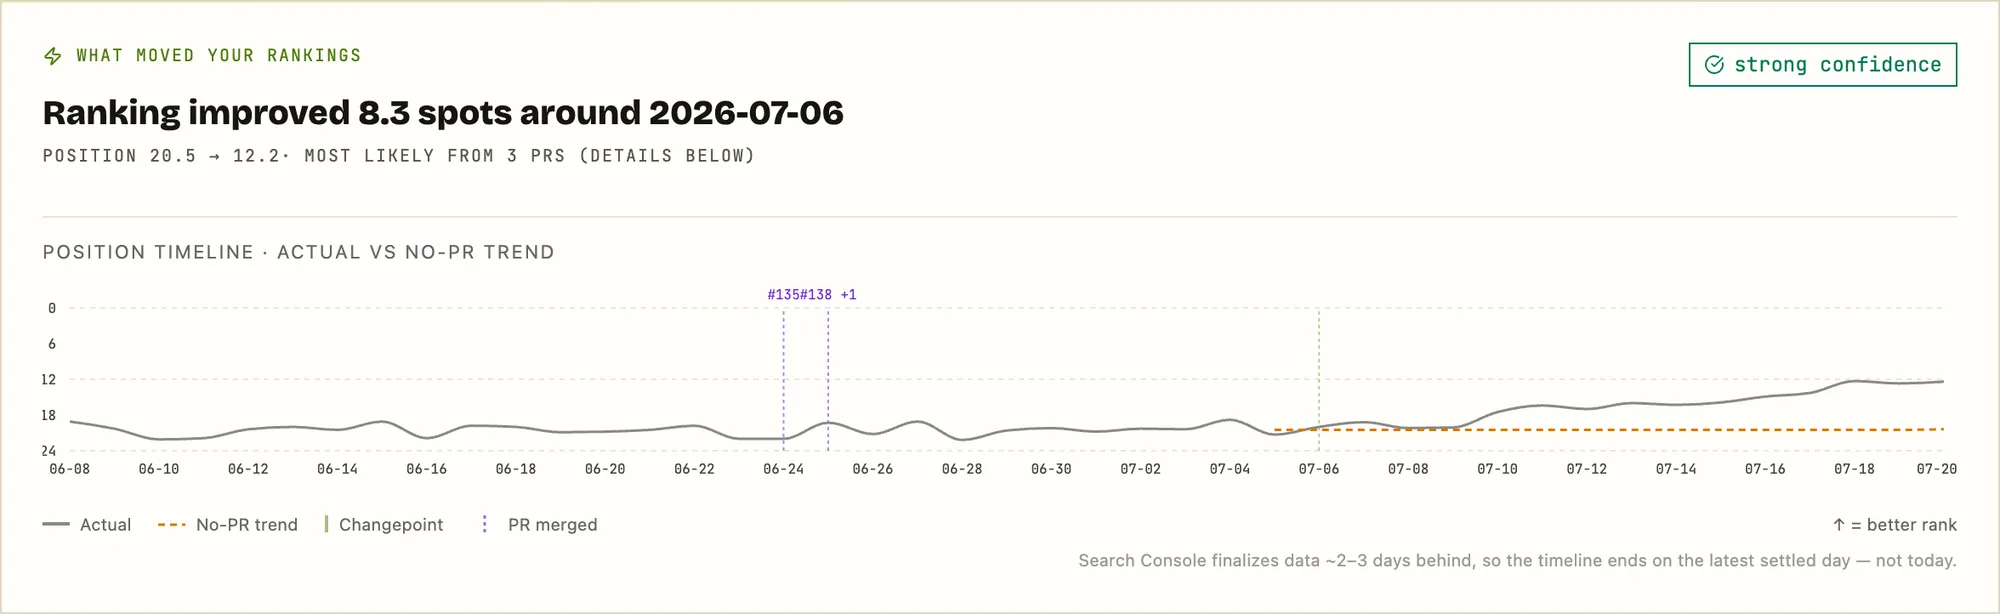
Statistical changepoint detection isolates when rankings genuinely shifted. Attribution cards link each shift to the exact PRs that caused it.
Try it on your repo.
Free plan · 3 min setup
Your team ships every week. But do you know what's working?
Search rankings move. Traffic fluctuates. Engineers ship. Connecting those two things has always required a spreadsheet, a guess, and a prayer.
Sample events · your feed builds itself from GitHub + Search Console.
Know the outcome before Google does.
Rankings take 10–21 days to react to a deploy. Your expectations shouldn't. The moment a PR merges, Code Results matches it against thousands of similar changes shipped by other teams and predicts the ranking impact — then the causal engine confirms it once your search data lands.
Sample prediction · from the same engine the dashboard runs on.
Not just correlation.
Actual causation.
Statistical changepoint detection + LLM attribution turns "something changed around here" into "these 3 PRs moved your ranking by 8.3 positions."
Position 30 to 2.
One PR out of twelve.
We found it a month late.
On February 14, 2026 the average Google position for ganttchart.ai — one of our own apps — jumped 25 spots overnight. Nobody on the team knew why. We pointed Code Results at the repo and the Search Console property, and it ranked the twelve PRs merged in the window.
Impressions fell 95% the same day while clicks held — Google narrowed the queries and raised the rank on the ones it kept.
Attribution reasoning · PR #203"The PR adds a new interactive Gantt chart editor section to the homepage, including new headings, content, and images with alt text, which directly affects user-facing page content and headings."
We never told it to look at the homepage, or that gantt-editor positioning mattered. It read the diff.
| PR | Merged | Title | Score |
|---|---|---|---|
| #203 | Jan 29 | Change homepage to include new gantt chart editor | 0.70 |
| #207 | Feb 12 | Add stripe subscription support, update faq, add settings page | 0.60 |
| #198 | Jan 28 | Integrate new gantt editor (20K+ lines changed) | 0.30 |
| #210 | Feb 13 | Add homepage video | 0.30 |
| #199 | Jan 25 | Remove mention of jira feature | 0.30 |
| #205 | Jan 30 | Uncap length limitations | 0.10 |
| #208 | Feb 9 | Fix OpenPanel SDK integration | 0.10 |
| #209 | Feb 13 | Add Export to Google Sheets button | 0.10 |
| #200 | Jan 25 | Remove data connections page | 0.10 |
| #211 | Feb 13 | Add Sentry SDK | 0.00 |
| #204 | Jan 30 | Start using AnannasAI as LLM provider | 0.00 |
| #202 | Jan 29 | Add OpenPanel analytics tracking | 0.00 |
#203 was the seventh-largest PR in the window by lines changed, wasn't tagged as SEO work, and merged 16 days before the shift — the re-index lag we usually see. Its author described it as "homepage update."
Our own repos. Our own Search Console. Run through the same engine you'd connect to.
Read the full case studySee your dashboard.
A snapshot of what Code Results looks like once you connect a repo and a Search Console site. Real layout, sample data.
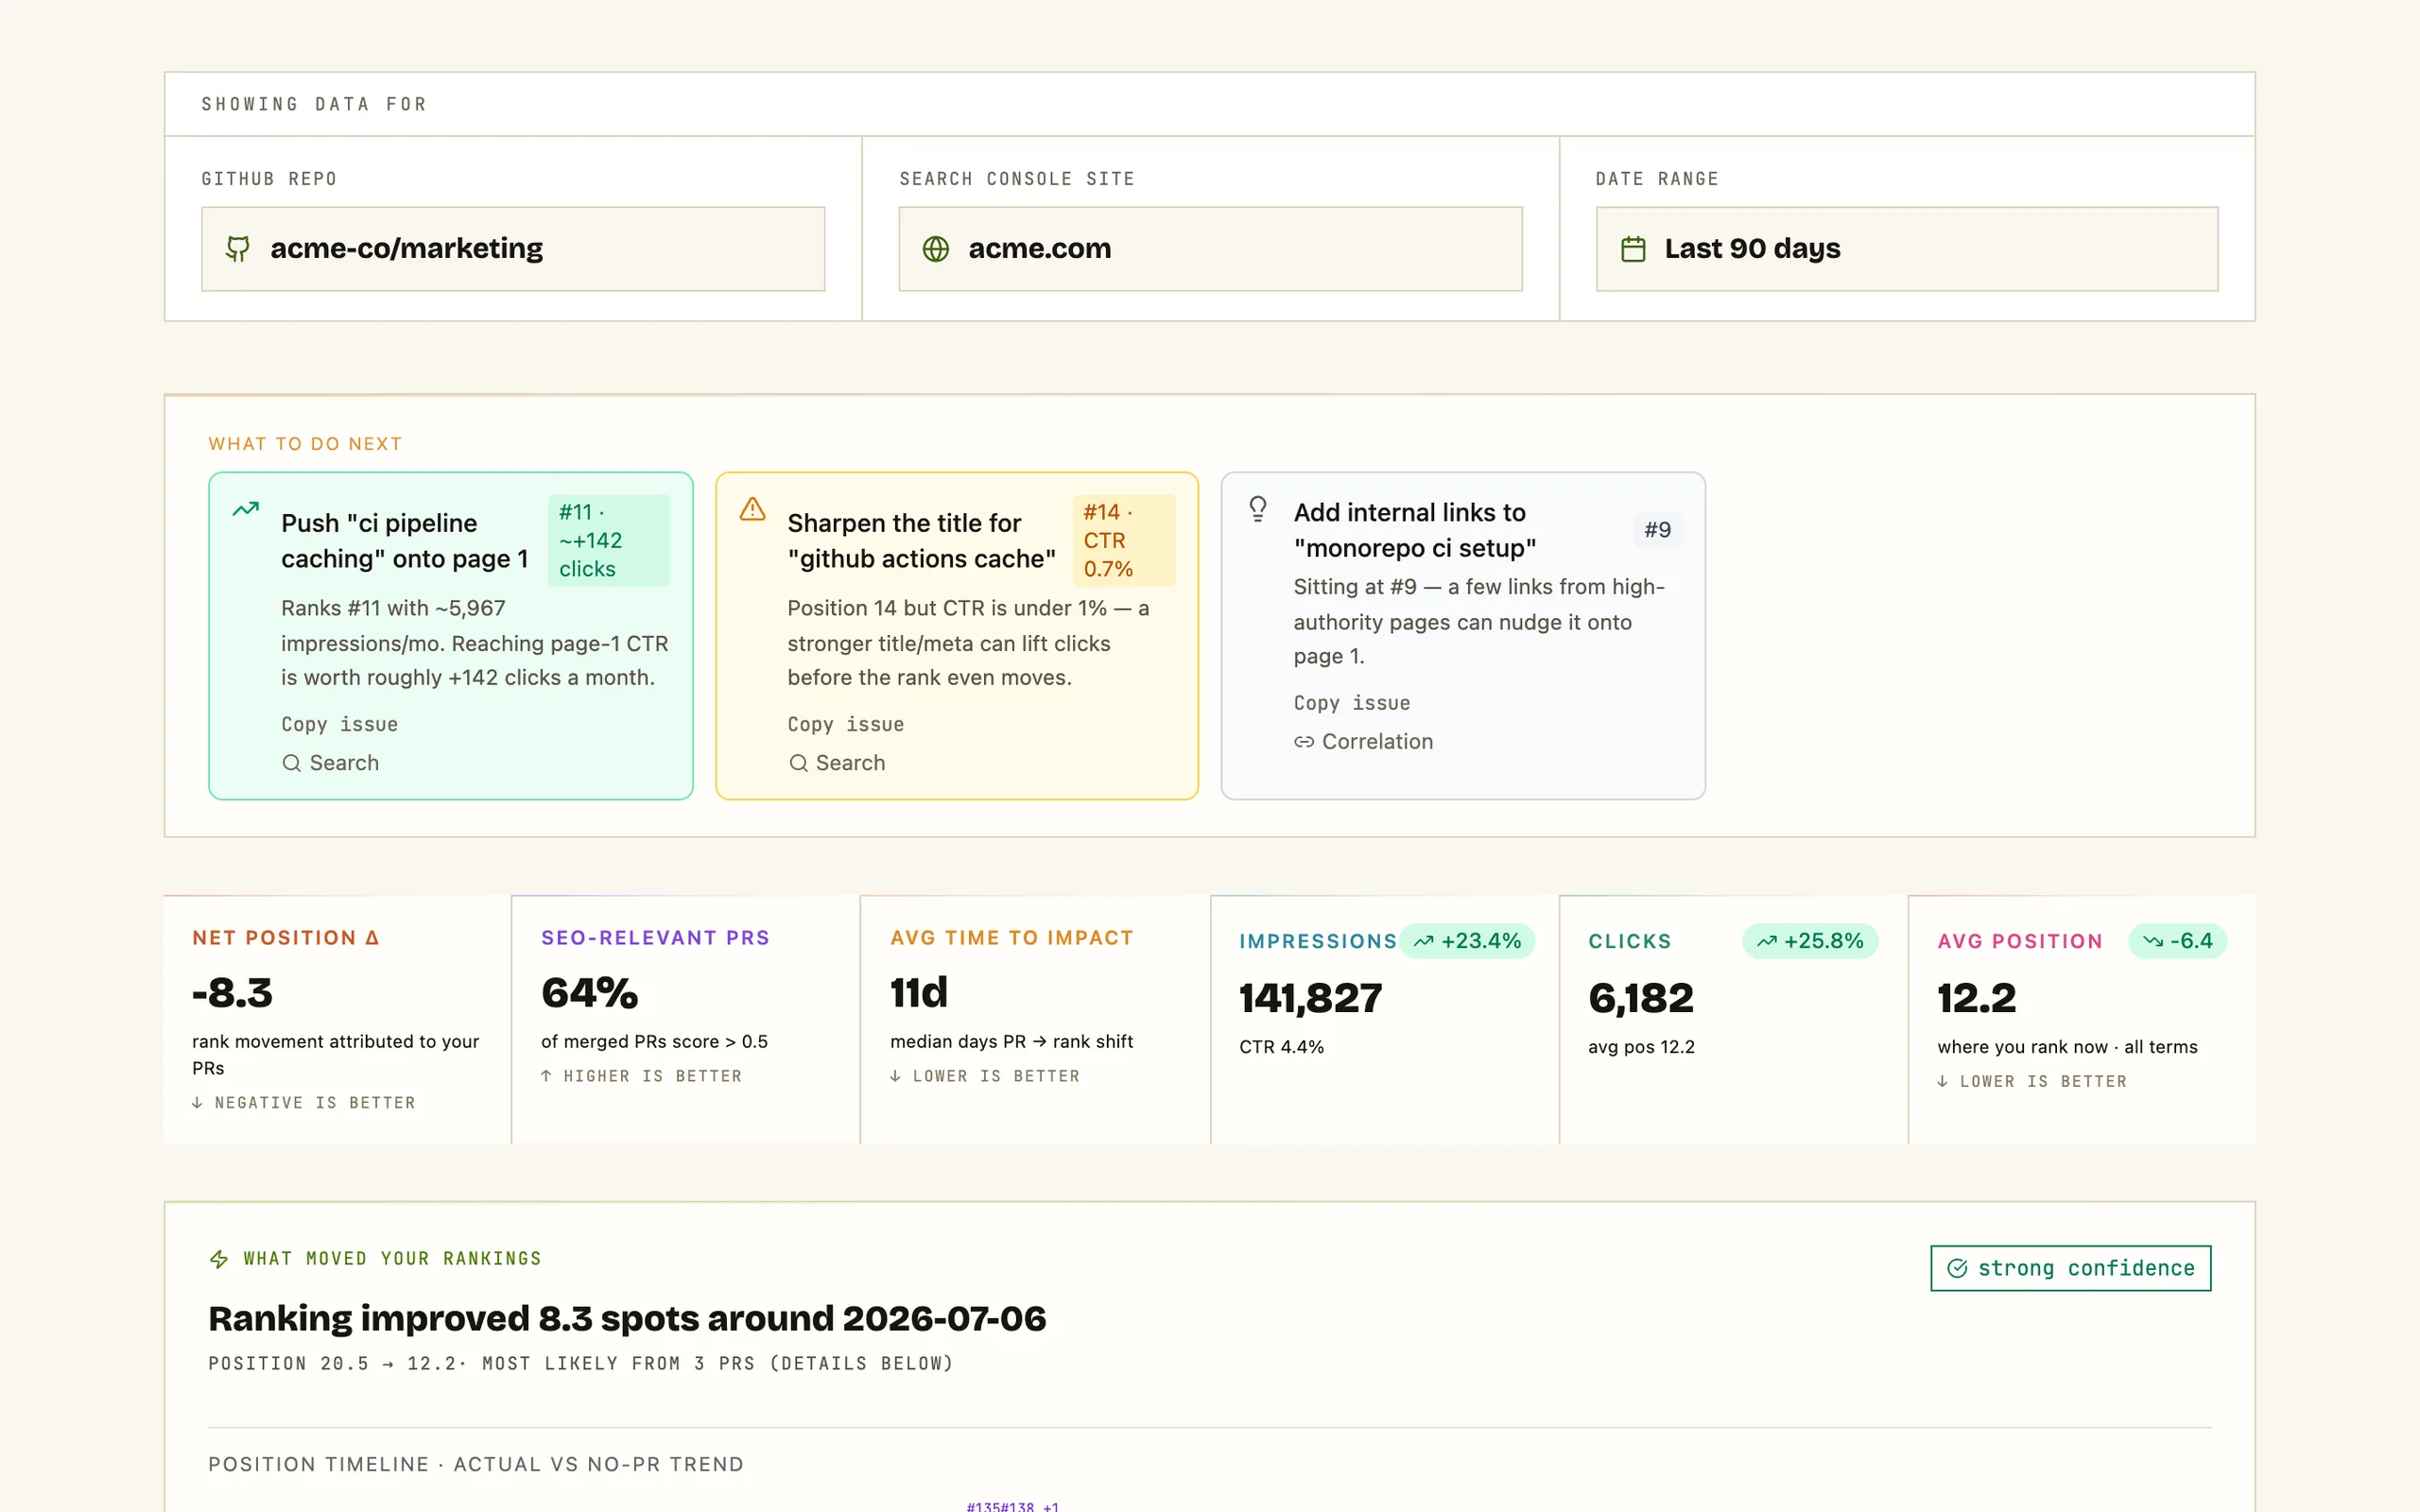
Sample data shown above · the real dashboard renders your live GitHub + GSC.
Bring your AI agent. It gets the full picture.
Code Results ships an MCP server. Claude — or any MCP-capable agent — gets read-only access to your search performance, your PR timeline, and the cross-company benchmarks. Grounded answers instead of generic advice.
- ›Five read-only tools: properties, daily performance, top queries, PR timeline, benchmarks
- ›Three installable skills: weekly SEO report, regression triage, ROI narrative
- ›OAuth consent scoped to your account — revoke anytime in Settings
$ claude mcp add --transport http code-results https://code-results.com/mcpSample exchange · your agent runs against your live data.
One platform. No stitching required.
Built for every seat at the table
CTOs get the org view. Managers get the team view. Everyone gets the answers they've been asking for.
- ›Org-wide velocity at a glance
- ›Engineering ROI by initiative
- ›Headcount vs output trends
- ›Board-ready reporting
- ›Team cycle time and throughput
- ›PR review bottlenecks
- ›Sprint-over-sprint comparison
- ›Contributor health signals
- ›Search impact of recent deploys
- ›Causal attribution per changepoint
- ›AI SEO score for every merged PR
- ›Content experiment results
- ›Feature ship-to-impact timeline
- ›Avg days PR → rank shift
- ›Cross-team velocity comparison
- ›Release cadence tracking
Ready to connect the dots?
Set up takes 3 minutes. No engineering required.
Start free. Go deeper with Pro.
The free plan is the product, not a trial — connect, contribute to the benchmark pool, and see your last 30 days. Pro unlocks everything.
- Last 30 days of search + PR history
- Core dashboard: metrics, correlation chart, changepoint spotlight
- Top search terms + 3 recommended actions
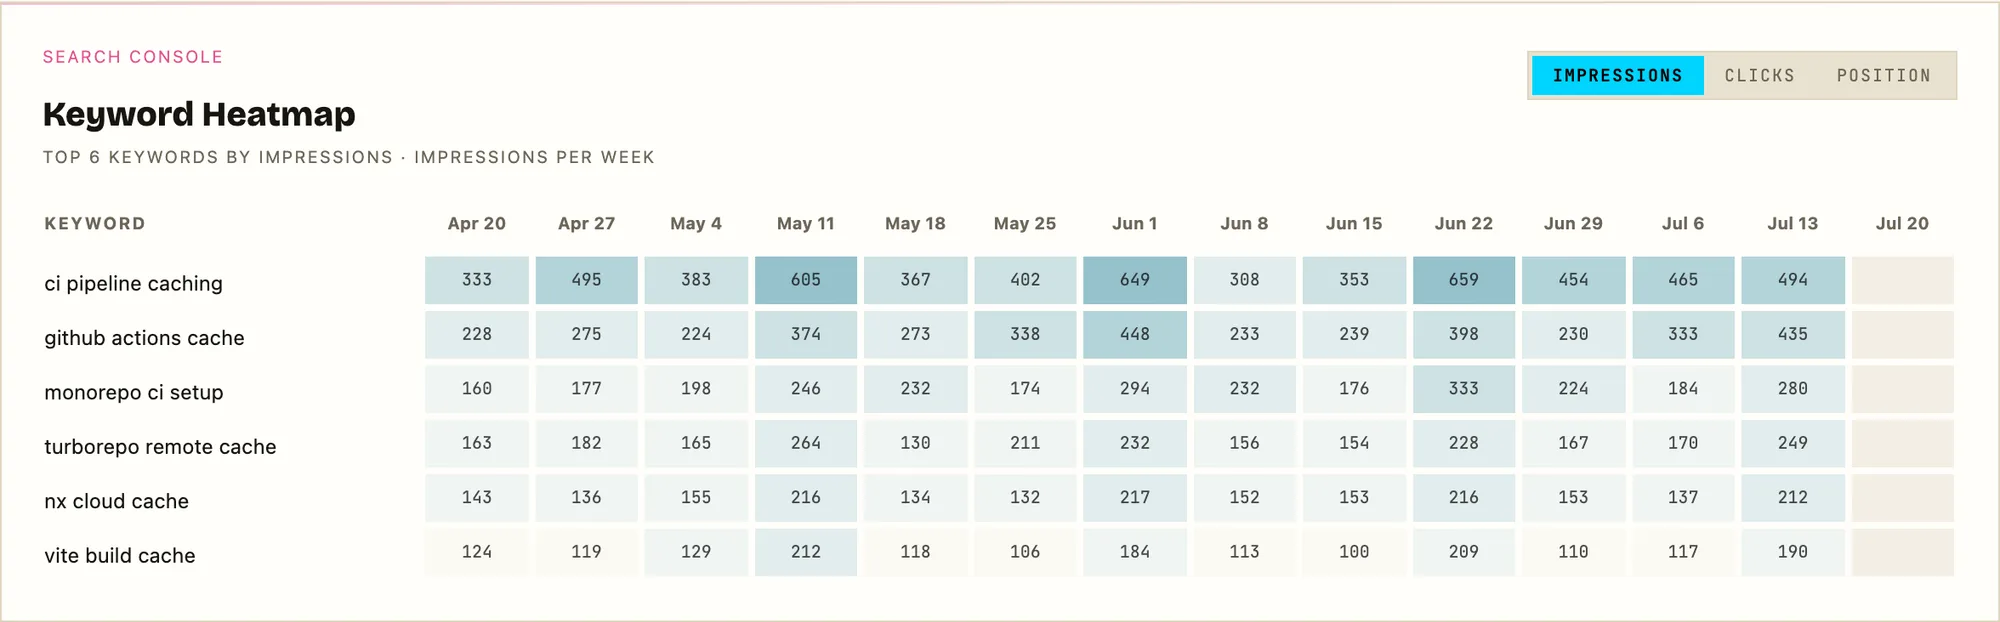
- Keyword workbench previews — top striking-distance terms, heatmap, and breakouts
- Benchmarks on the global cohort
- Unlimited repos and sites — your data joins the anonymized benchmark pool
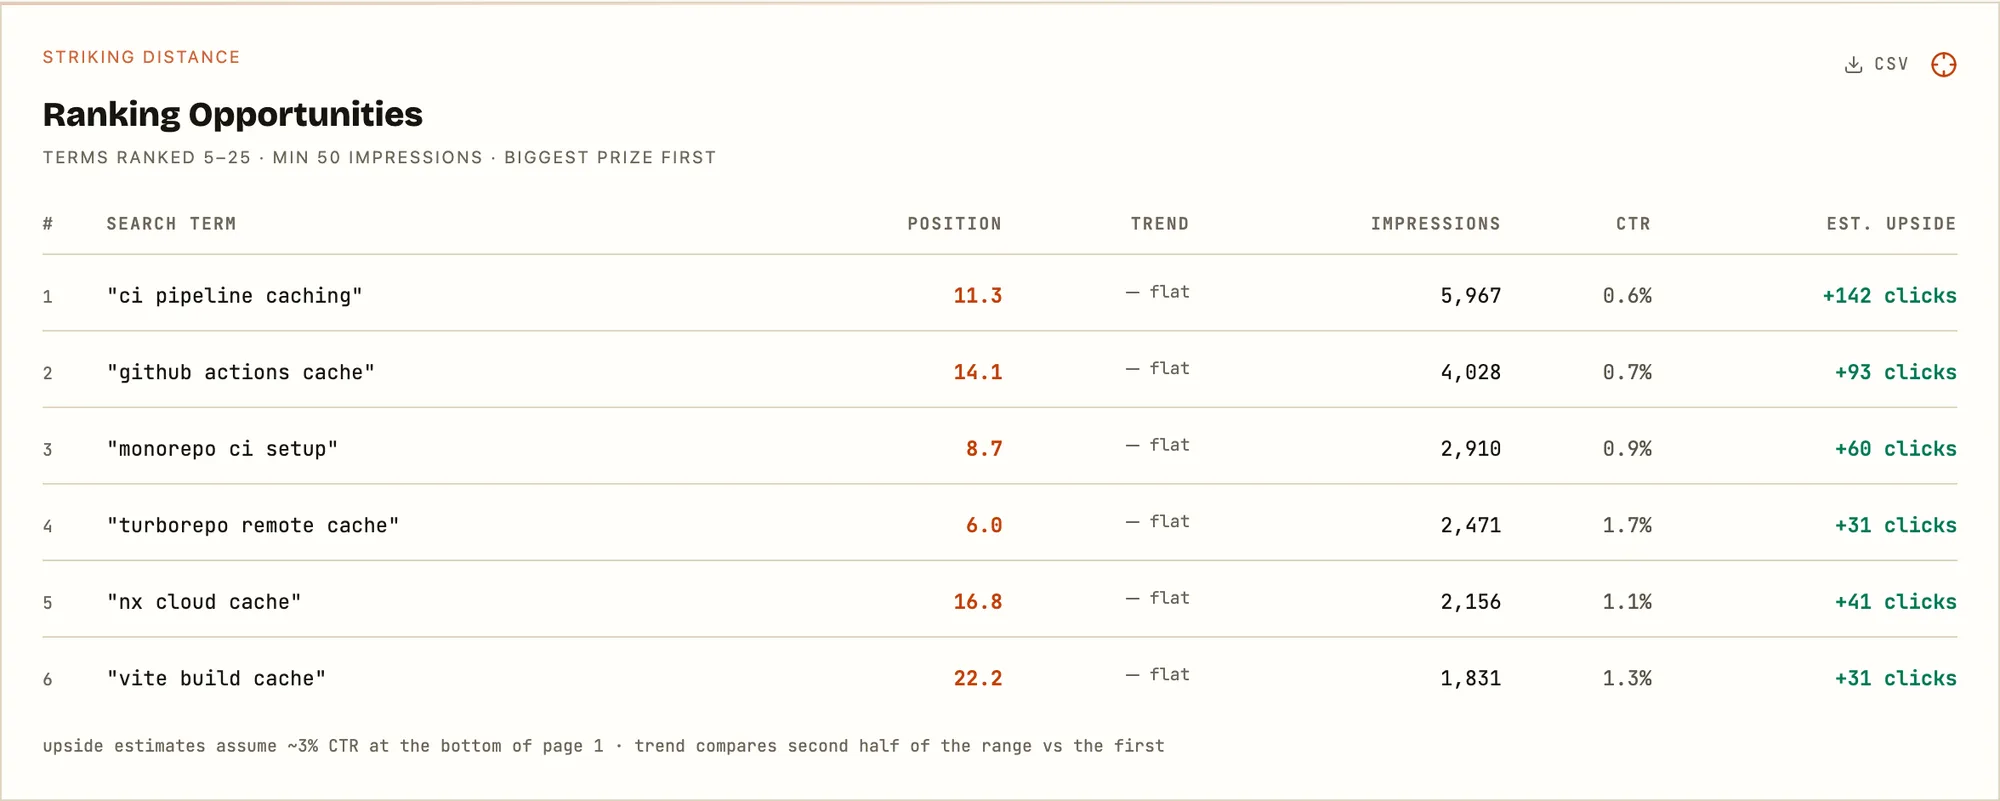
- Striking distance + cannibalization — page-one opportunities, with estimated click upside
- Keyword heatmap + per-term breakouts for your top keywords
- Your full synced history — no 30-day window
- At-merge ranking predictions + live site health checks
- Opt your data out of the benchmark pool
- Unlimited saved views
Up and running in minutes
No complex setup. No engineering required. Just connect and go.
Connect GitHub
Install the Code Results GitHub App and select which repositories to track. We handle everything else — including automatic repo-to-site matching.
Link Search Console
Authorize Google Search Console access with one click. We sync your search data and automatically pair your sites to the right repos.
See the impact
Your unified dashboard is live. Correlations, causal changepoints, and AI attribution emerge automatically as your team keeps shipping.
Questions, answered.
Do you need write access to my code?+
Is my Search Console data safe?+
How long until I see results?+
What if my site doesn't get much search traffic yet?+
How is this different from Ahrefs or Semrush?+
How much does it cost?+
Field notes on code & rankings
How engineering work actually moves organic search — crawl lag, causal attribution, and the deploy-level mistakes that quietly tank rankings.
SEO attribution tools: a methods guide
Your engineering team merged forty pull requests last month. Organic clicks are up 12%. Most teams cannot say which changes did it. A taxonomy of the five methods that connect what you shipped to what Google did — including where each one honestly breaks down.
Read postDiscovered – currently not indexed: what it means and how to fix it
Google knows your URL exists and has chosen not to fetch it. It is not an error, and on a small site it is almost never the "crawl budget" problem the guides tell you to fix — it is crawl demand. What the status actually means, why our own posts sat in it, and the structural fixes that ship in a pull request.
Read postNext.js SEO: the deploy-level changes that move rankings
A client-only SPA fails SEO loudly — the crawler gets an empty shell. Next.js fails it quietly: it renders on the server by default, so a one-line diff can flip a whole route subtree to dynamic, delete a page's metadata, or push its tags out of Google's first crawl — with no error and no failing test. The deploy-level regressions to check by sight.
Read postStop guessing.
Start knowing.
Connect a repo and a Search Console property, and the first attribution lands before your next sprint review.
Read-only GitHub access · Revoke anytime · We never write to your repos